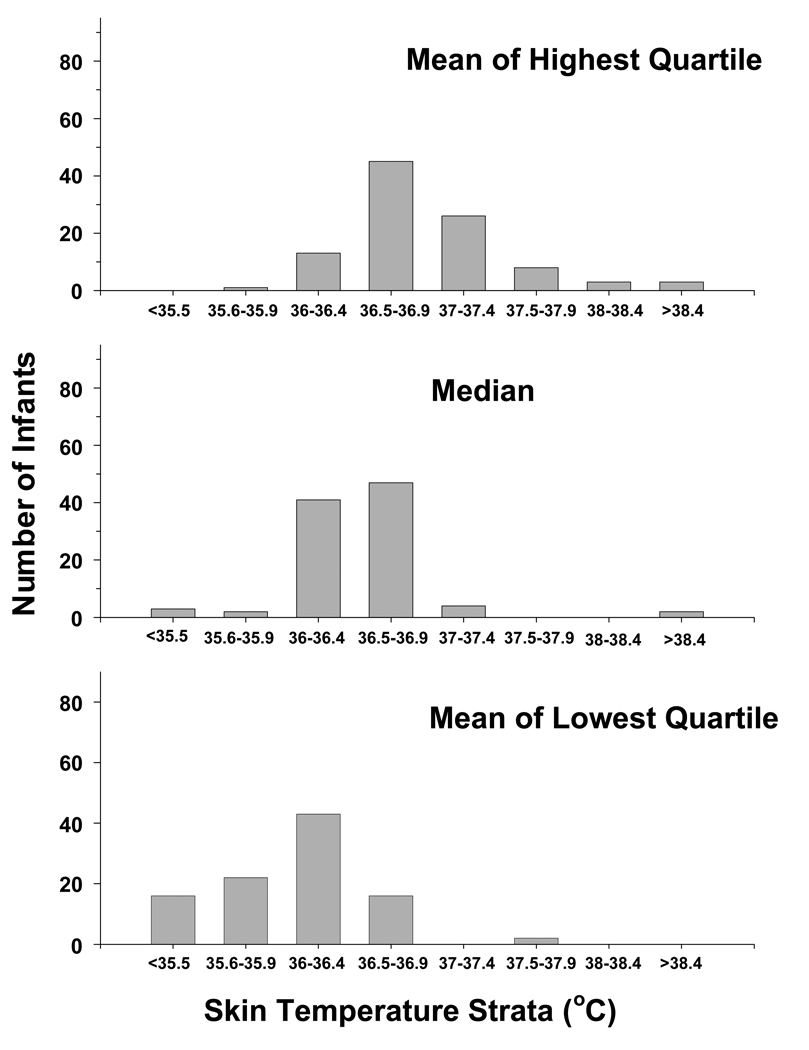
Figure III.
The distribution of control infants is plotted among strata of skin temperature for the average (avg) of the highest quartile (top panel), median (middle panel), and average of the lowest quartile (lower panel) of temperature. The strata are in 1.0°C increments to facilitate viewing the distribution of the data

