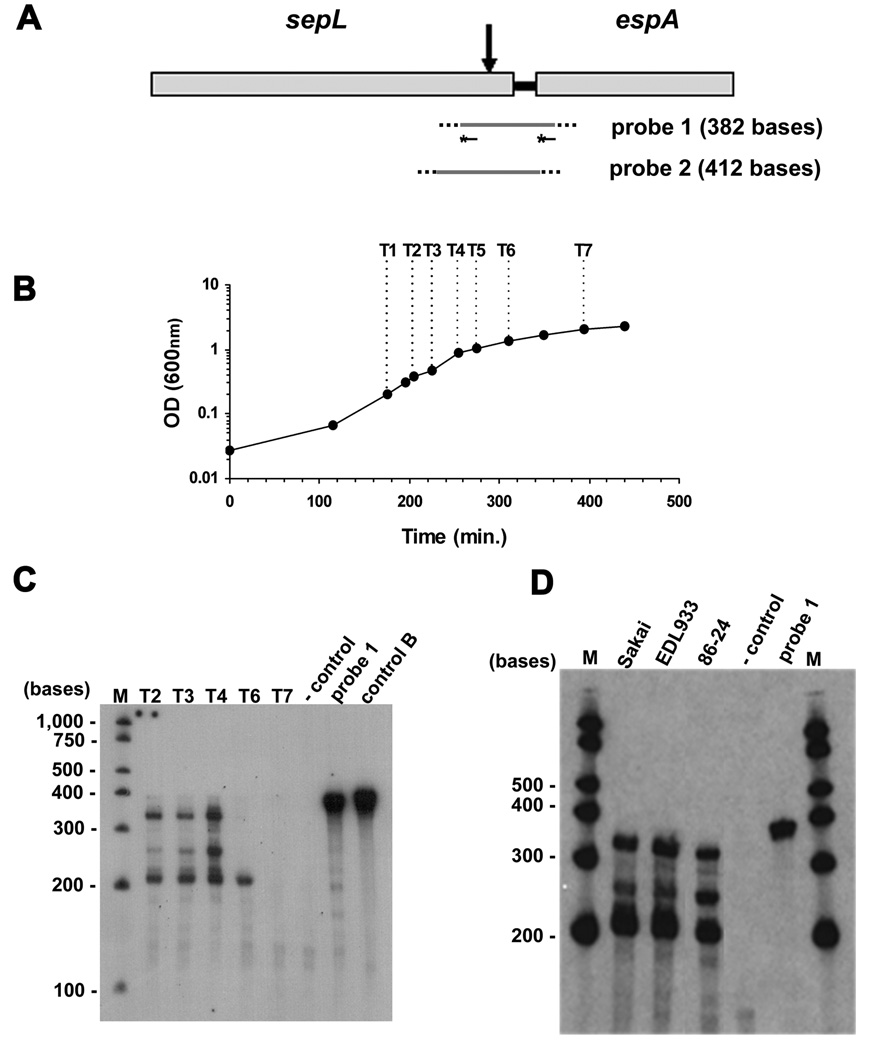
Fig. 2. A pattern of different ‘esp’ transcripts are detected by RPA.
A. Schematic representation of the probes used for RPAs. Both probes (grey lines) span the 3’ end of sepL, the intergenic region, and the 5’ end of espA (Table I and Experimental Procedures). They also contain non-complementary sequences at the ends (dotted lines). Lines with stars represent DNA oligomers complementary to sepL and espA sequences of probe 1 (Table I). These oligomers were labeled with [γ32P]ATP and used in the experiment shown in Fig. 3. The vertical arrow indicates the main processing site found at the end of sepL.
B. Sakai was grown in DMEM 1% glucose and samples were collected at different OD600 readings (arrows) for RNA extraction.
C. RPA was performed with probe 1 and total RNA extracted from bacteria at different OD600 readings corresponding to points labeled as T1 to T7 (B). Probe 1 was mixed with total yeast RNA and RPA was performed without RNase T1 treatment (lane ‘probe 1’). As a negative control, an RPA including RNase T1 treatment was done with yeast RNA and probe 1. An RPA including RNase T1 treatment was done with probe 1 and an in vitro transcribed complementary RNA (lane ‘control B’).The products were resolved in a 5% polyacrylamide/urea gel. (M) Century Plus Marker (Ambion).
D. RPA was performed with probe 1 and total RNA extracted from different EHEC strains as indicated. Bacteria were grown in DMEM 0.2% glucose to the end of exponential phase, and samples were collected for RNA extraction. After RPA, the products were resolved in a 5% polyacrylamide/urea gel.

