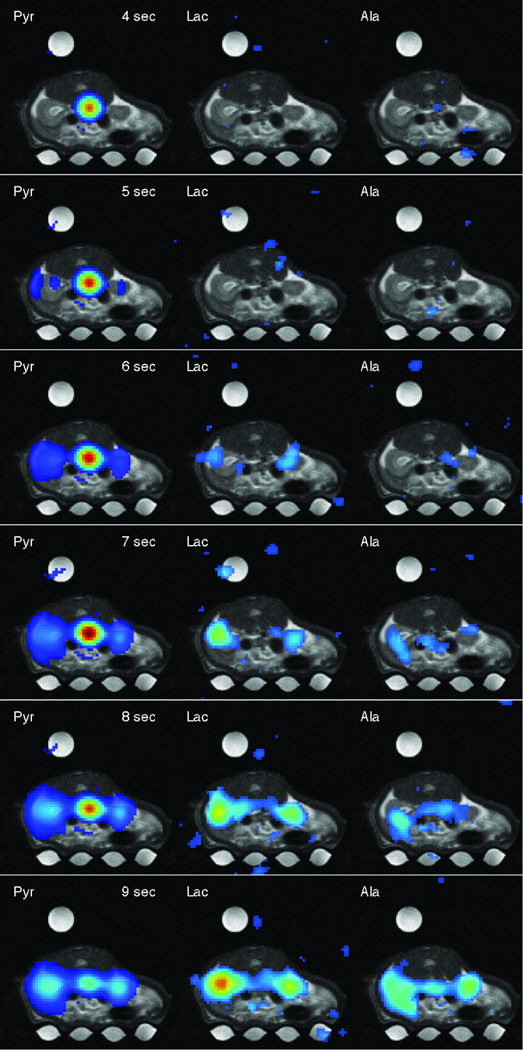
Figure 5.
Six frames of a time series of metabolic maps of Pyr, Lac, and Ala (superimposed onto the corresponding proton MRI) acquired from 10-mm slice through the kidneys. Each metabolic time series is individually scaled (threshold at 8% for Pyr and 20% for Lac and Ala). The time stamps are relative to time of injection. The complete movie is online at http://www.stanford.edu/~dirkm/MRMmov/rat_kidney.mov.

