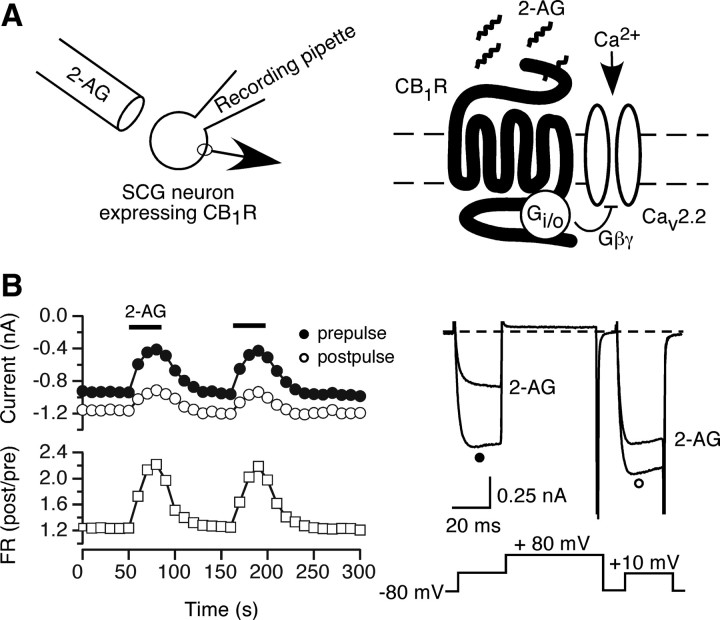
Figure 1.
Modulation of Ca2+ current by 2-AG in rat SCG neurons expressing CB1Rs. A, A schematic representation for Gi/o-mediated ICa inhibition via CB1R activation. Left, The diagram depicts the whole-cell patch-clamping mode from an SCG neuron previously injected with CB1R cDNA. Right, Externally applied 2-AG from a drug perfusion system activates Gi/o-protein coupled CB1R and inhibits ICa by Gβγ. B, Time courses of ICa (left) and superimposed current traces (right) evoked with the voltage protocol illustrated (right bottom) from CB1R injected SCG neurons. The ICa amplitude generated by the prepulse (filled circles) and post-pulse (open circles) are plotted. FR was calculated as the ratio of the post-pulse to prepulse ICa amplitude (open squares). The horizontal bars indicate the duration of 2-AG application.

