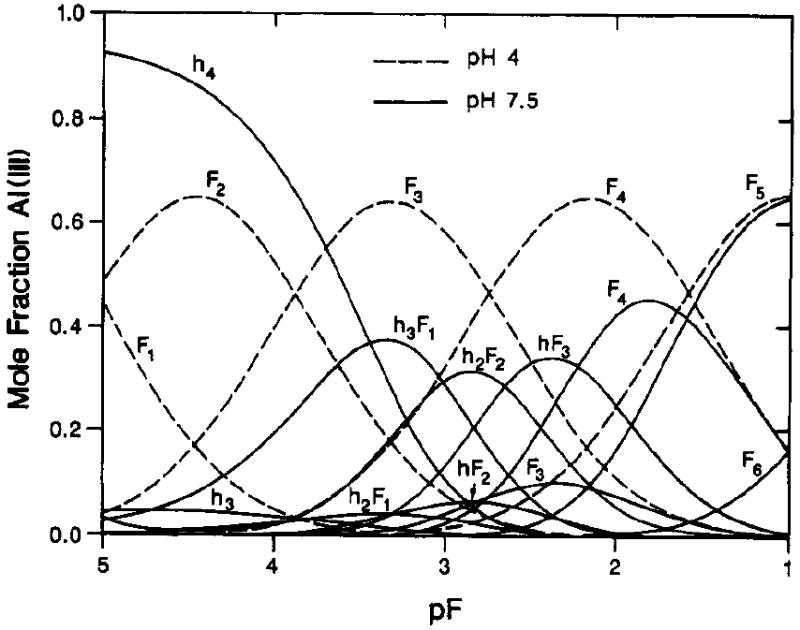
Figure 3.

Mole fraction of total Al(II1) v.s. pF = -log [F-], where [F-] is the ambient fluoride molar concentration; for fluoride complexes of aluminium at two pH values, dashed curves for pH 4 and solid curves for pH 7.5. Symbols on curves designate number of fluoride (F) or hydroxy groups (h) bound to Al(III). Thus h4 represents Al(OH)4-, F4, AlF4-, and hF3, (HO)AlF3-. Reprinted with permission from Martin (1994). Copyright 1994 American Chemical Society.
