
Figure 4.
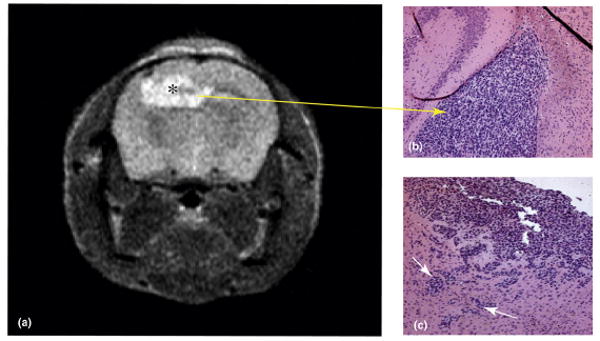
Human glioblastoma xenograft generated in an athymic nu/nu mouse eight weeks after the intracranial implantation of neurospheres harvested from a resected glioblastoma specimen. a) T2-weighted MRI of mouse brain showing xenograft (marked by *). b) Hematoxylin/eosin stained section of mouse brain showing xenograft (marked by arrow). c) Hematoxylin/eosin stained section of mouse brain demonstrating the invasion of human glioblastoma xenograft into surrounding brain (marked by arrows).