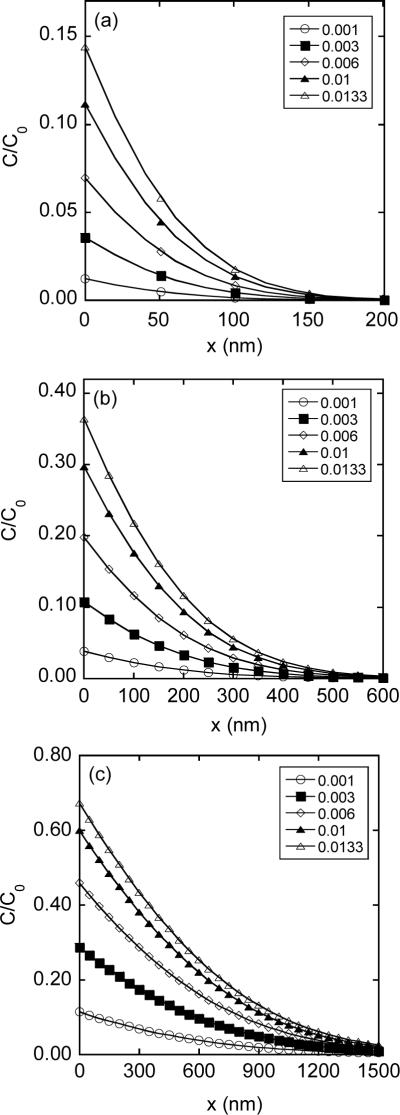
Figure 7.
Spatial distribution of intracellular concentration of FD-4 for different pore opening periods (T): (a) T = 0.1 msec; (b) T = 1 msec; and (c) T = 10 msec. The concentration profiles were normalized by the concentration in pulsing medium (C0). The value of hδ was varied from 0.001 to 0.0133 (see the legend of Figure 6).

