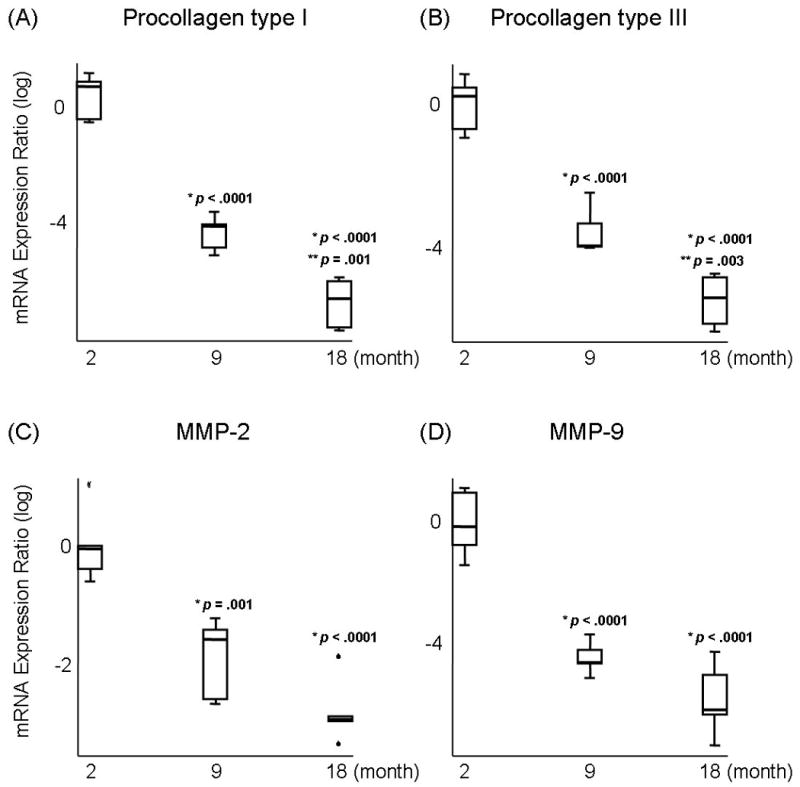
Fig 1.

Log-transformed mRNA expression ratios of (A) Procollagen type I, (B) Procollagen type III, (C) Matrix metalloproteinase (MMP)-2, and (D) MMP-9 in young (2 month), adult (9 month), and elderly vocal folds (18 month). Boxes indicate first and third quartiles. Whisker caps indicate smallest and largest non-outlier observations. Outlier indicated by °. Extreme indicated by  . Median observations denoted by thick black line in each box. p values indicate a significant difference from (*) young and (**) adult vocal folds.
