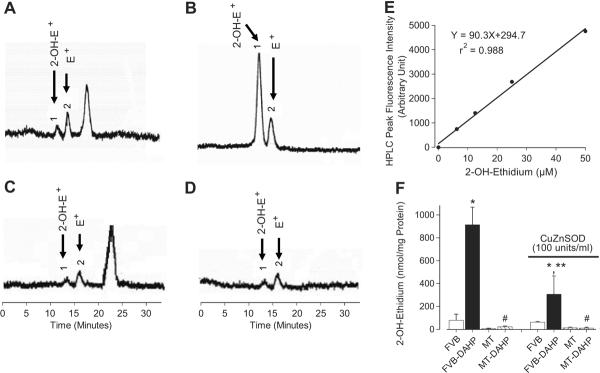
Fig. 2.
HPLC identification of 2-OH-E+ from the O2•_/HE reaction in cardiomyocytes. Panels A – D display the HPLC chromatograms from FVB (A), FVB-DAHP (B), MT (C) and MT-DAHP (D) groups. Panel E: Standard HPLC peak intensity of authentic 2-OH-E+. Panel F: Levels of 2-OH-E+ in FVB, FVB-DAHP, MT and MT-DAHP groups with or without copper zinc SOD (100 units/ml). 2-OH-E+: 2-Hydroxyethidium (labeled peak 1); E+: Ethidium (labeled peak 2). Mean ± SEM, n = 100–120 cells per group, * p<0.05 vs. FVB, # p<0.05 vs. respective FVB-DAHP group, ** p<0.05 vs. FVB-DAHP group in the absence of SOD.

