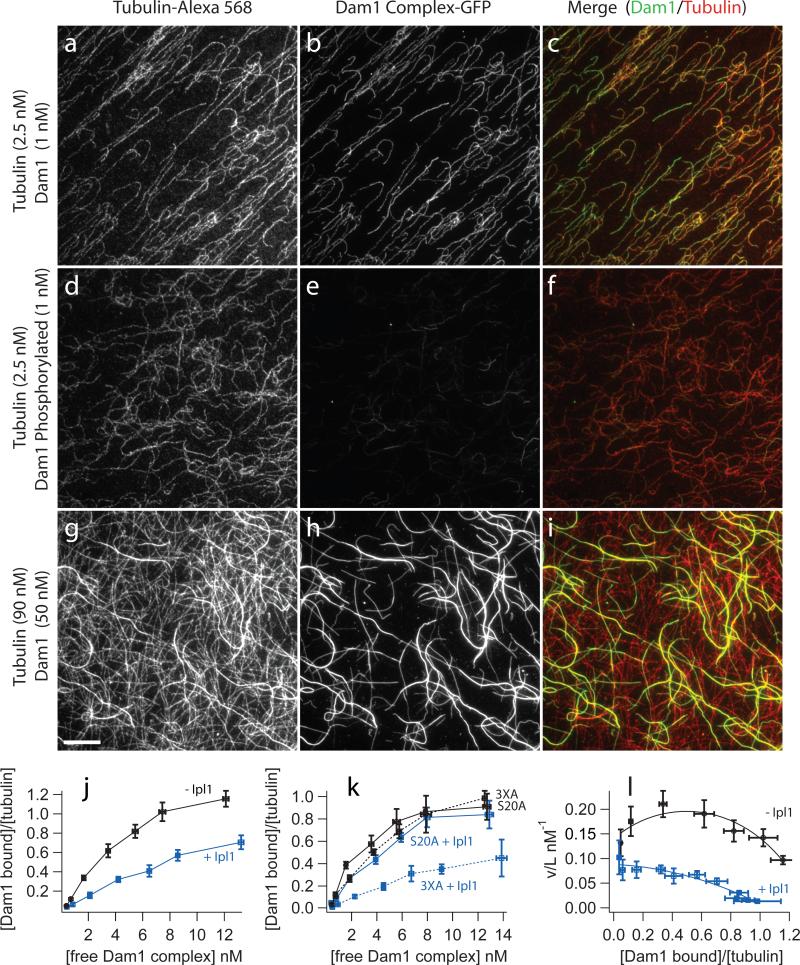
Figure 2. Phosphorylation of Dam1 Ser 20 by Ipl1 decreases microtubule affinity of the Dam1 complex.
Binding of GFP-tagged Dam1 complex to microtubules assembled from Alexa-568 labeled-tubulin was recorded by fluorescence microscopy as described in the Methods. (a-f) Representative images of Dam1 complex (1 nM) either unphosphorylated (a-c) or phosphorylated by Ipl1 (d-f) bound to taxol-stabilized microtubules (2.5 nM tubulin dimer). Thousands of such images (n>2000) were analyzed to generate the binding curves shown below (j-l). (g-i) Images of higher concentrations of the Dam1 complex (50 nM) binding to microtubules (at 90 nM tubulin dimer) highlight the cooperativity of binding. The scale bar in (g) applies to panels (a-i) and represents 10 μm. The intensities of images in a given column were scaled the same. (j) Plot of binding data with binding density, ν, on the vertical axis plotted against free ligand concentration, L. Unphosphorylated Dam1 complex (black symbols), Dam1 complex phosphorylated by Ipl1 (blue symbols). Data are mean ± s.e.m. from 8−11 (unphosphorylated) and 4−10 (phosphorylated). (k) Plot comparing microtubule binding of mutant Dam1 complexes with Ala substitutions at residues targeted by Ipl1. Even when phosphorylation was blocked at three of four target residues (3XA), the affinity of the complex for microtubules is severely reduced after Ipl1 treatment (blue dotted curve), compared with the untreated control (black dotted curve). Conversely, when phosphorylation is blocked at a single Ser residue (S20A), Ipl1 treatment caused no significant reduction in binding (blue solid curve) relative to an untreated control (black solid curve). Data are mean ± s.e.m. from three replicates. (l) Scatchard plot of the same data shown in (j), unphosphorylated Dam1 complex (black symbols), Dam1 complex phosphorylated by Ipl1 (blue symbols). The curves represent the fit to the McGhee and von Hippel model30.

