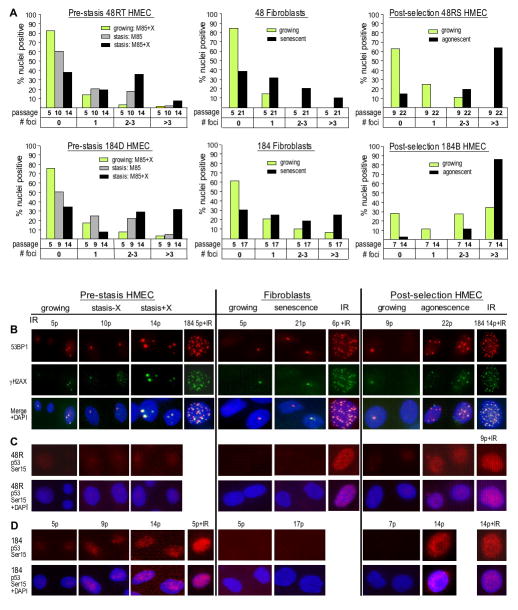
Figure 4.
Markers of DNA damage in growing and senescent pre-stasis and post-selection HMEC, and isogenic HMFC. Senescent cultures were examined one passage prior to when cultures showed no net increase in cell number. A. 53BP1 foci; Note the higher level of foci in agonescent HMEC compared to senescent HMFC or HMEC at stasis, and the higher level of foci in cells from specimen 184 compared to specimen 48. B–D. Representative IF images of growing and senescent pre-stasis and post-selection HMEC, and isogenic HMFC. B: 53BP1 and γH2AX foci in specimen 48; C–D: activated p53 in specimens 48 and 184. Cells exposed to 10 Gy of IR are shown as positive controls. Note the greater number of foci, and higher level of serine15-phosphorylated p53 in agonescent HMEC compared to senescent HMFC or HMEC at stasis. Cultures examined are from the growth curve shown in Fig. 1A.

