Figure 5.
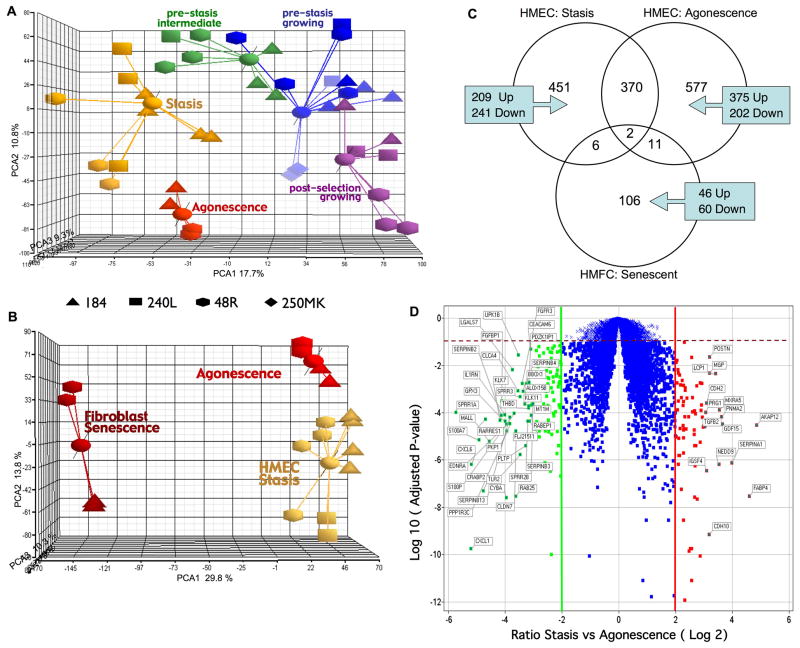
Relationship of growing and senescent HMEC and HMFC as determined by transcriptional profiles. A. PCA plot of transcriptional profiles of growing and senescent pre-stasis and post-selection HMEC. B. PCA plot of transcriptional profiles of all senescent HMEC and HMFC. The 3D scatter plots show the first three principal components of the analysis of 9702 genes. Data points from different individuals are represented by different shapes. C. Venn diagram of genes modulated at HMEC stasis using growing pre stasis as baseline, at HMEC agonescence using growing post selection as baseline, or at HMFC senescence with growing fibroblast as baseline. Diagram depicts the number of genes unique to each group and the number that overlap between and among the groups. D. Volcano plot illustrating genes significantly differentially expressed between stasis vs. agonescence. The x- axis represents the fold change ratio (log2) between HMEC at stasis and agonescence. The y-axis represents the significance with adjusted p-values. The graph is segmented to represent the genes that satisfy the fold change criteria of +/− 2 and adjusted p <0.1. Segments on right and left show the genes up-regulated at agonescence (79) and stasis (116) respectively. Genes with more then eight fold change difference between stasis and agonescence are labeled.

