Figure 3.
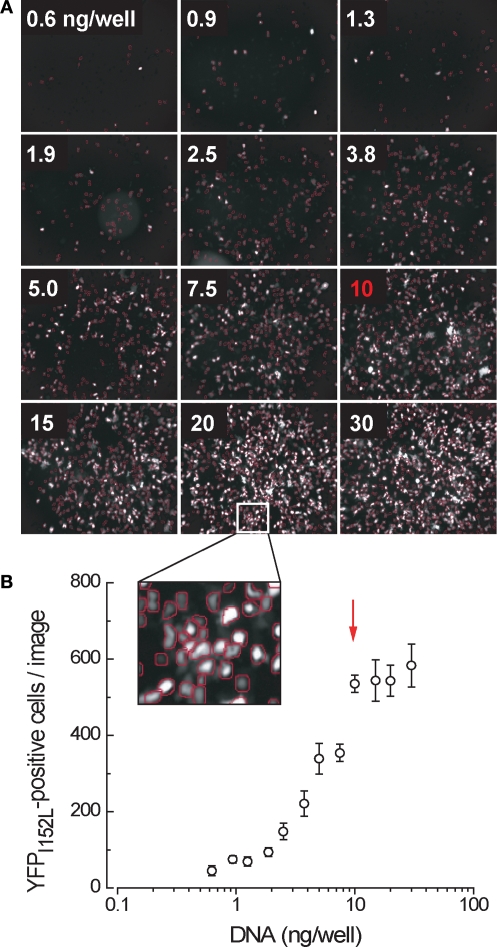
Yellow fluorescent protein expression in cells transfected in single wells of a 384-well plate as a function of the amount of cDNA transfected. (A) Sample results from a single experiment. All wells contained an equivalent number (∼5000) of cells. (B) Mean number of fluorescent cells per image, averaged from four independent experiments. Arrow denotes point of optimal transfection efficiency.

