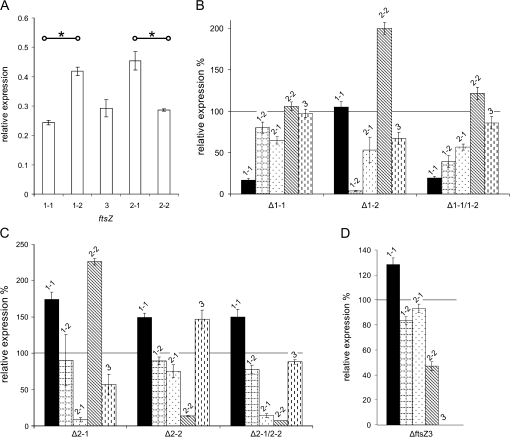
Figure 6.
FtsZ Transcript Abundance in Wild-Type and in ftsZ Single and Double Knockout Mutants.
(A) Relative expression level of all five ftsZ genes in wild-type. Asterisks indicate significant differences (ANOVA, Tukeys HSD, P < 0.001) between two members of the same family.
(B–D) Wild-type is set to 100% (black line) to depict relative expression levels of the single ftsZ in the mutants. The graphs are grouped by gene family: (B) FtsZ1, (C) FtsZ2, and (D) FtsZ3. Error bars indicate the standard deviation (n = 3). Significant changes in transcript abundance in the wild-type (t-test, P < 0.001) are indicated by an asterisk.

