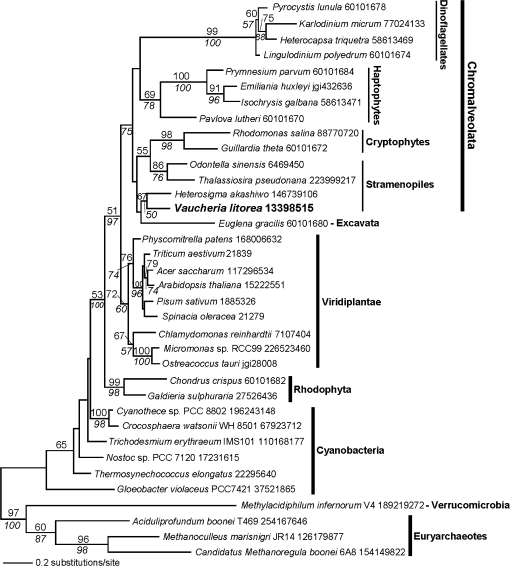
Figure 8.
Maximum Likelihood (PhyML) Phylogenetic Analysis of PRK in Cyanobacteria, Algae, and Plants.
The results of bootstrap analyses are shown with the PhyML bootstrap values above and the RAxML bootstrap values below the branches. The branch lengths in the trees are proportional to the number of substitutions per site (see scale in figure). The branch uniting the cyanobacteria was used to root this phylogeny.

