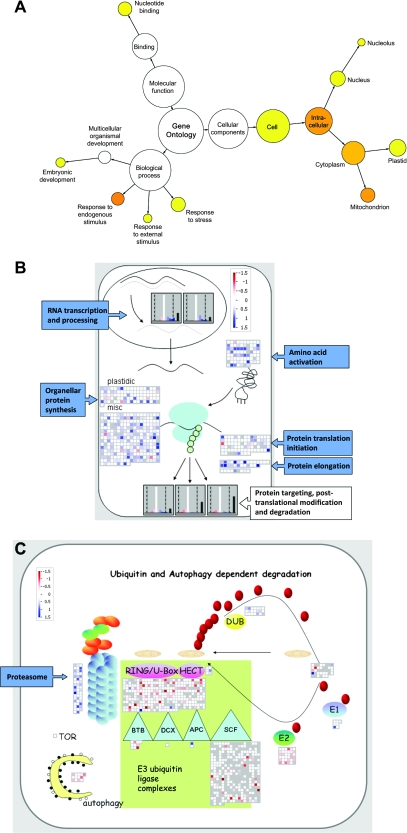
Figure 6.
Alterations in the Transcriptome of mex1 Revealed by Microarray Analysis.
(A) Gene Ontology (GO) analysis of transcripts significantly altered in abundance in mature leaves of mex1, relative to the wild-type. Over-represented categories relative to the genomic average are visualized using Cytoscape (Shannon et al., 2003) and colored yellow (p ≤ 5 × 10⁻²) to orange (p ≤ 5 × 10⁻⁷).
(B) Transcript levels of genes involved in RNA metabolism and translation visualized using MAPMAN. Transcripts are shown either individually as squares, or collectively as frequency histograms. Changes in mature mex1 leaves relative to the wild-type are shown in color (blue, up-regulated; red, down-regulated; white, no change) on a log2 scale as indicated. Gray squares in the displays and black bars on the histograms indicate genes called as ‘not present’ on all of the microarrays. In the gene categories shown, there were almost no changes in young mex1 leaves relative to the wild-type (not shown).
(C) Transcript levels of genes involved in protein degradation visualized using MAPMAN, as in (B). In the gene categories shown, there were almost no changes in young mex1 leaves relative to the wild-type (not shown).

