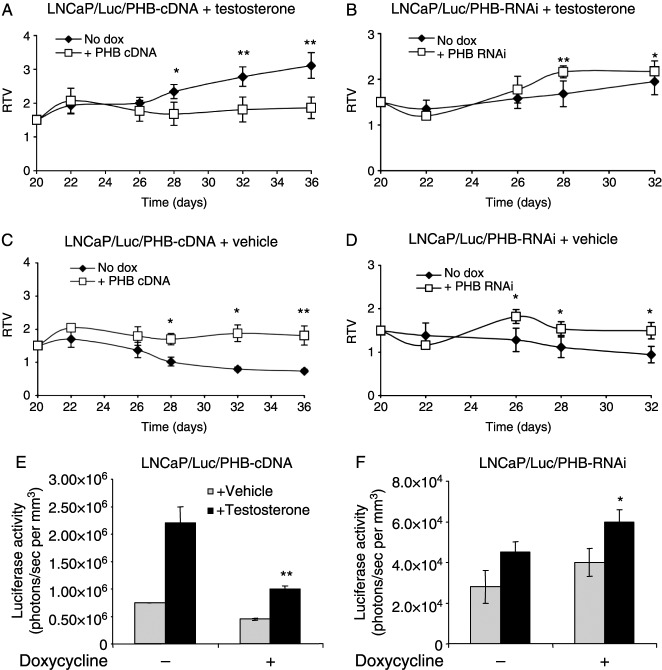
Figure 4.
Effects of manipulating PHB levels on tumour growth and AR activity in vivo. (A–D) Relative tumour volumes of LNCaP/Luc xenografts with increased (A and C) or decreased (B and D) PHB levels in castrated nude male mice treated with (A and B) or without (C and D) testosterone. Each point represents mean±s.e.m. of six to eight tumours. **P<0.01, *P<0.05 (Mann–Whitney analysis). (E and F) Bioluminescent imaging results from LNCaP/Luc/PHB-cDNA (E) and LNCaP/Luc/PHB-RNAi (F) tumours at day 36. **P<0.01, *P<0.05 (t-test).

