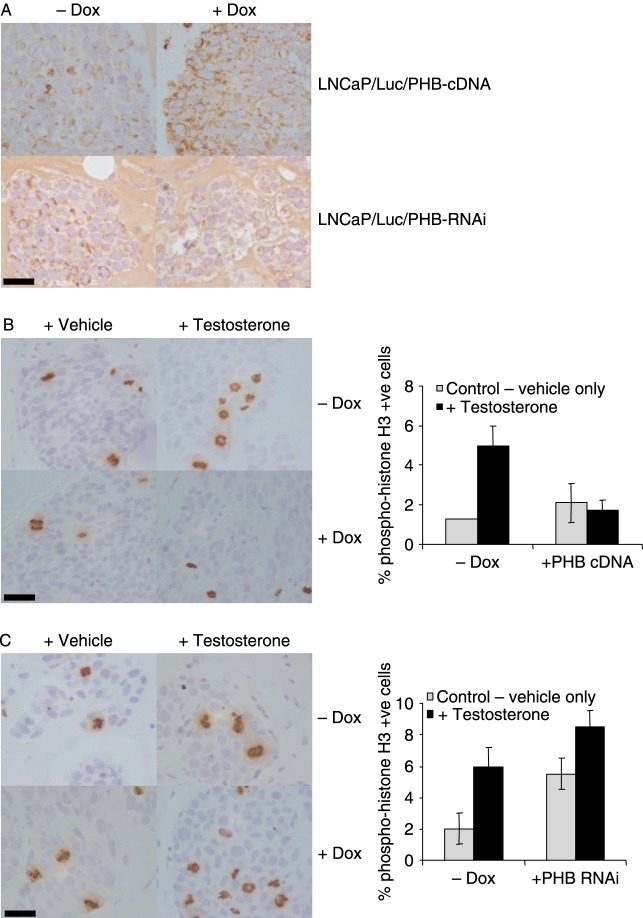
Figure 5.
Immunohistochemistry analysis of formalin-fixed tumour sections. (A) PHB staining of LNCaP/Luc/PHB-cDNA (upper panel) and LNCaP/Luc/PHB-RNAi (lower panel) from mice±doxycycline. (B and C) Phospho-histone H3 staining of LNCaP/Luc/PHB-cDNA (B) and LNCaP/Luc/PHB-RNAi (C) tumours from mice treated±testosterone and ±doxycycline. Phospho-histone H3-positive cell counts from five separate tumours are shown on the right. Scale bar, 25 μm.

