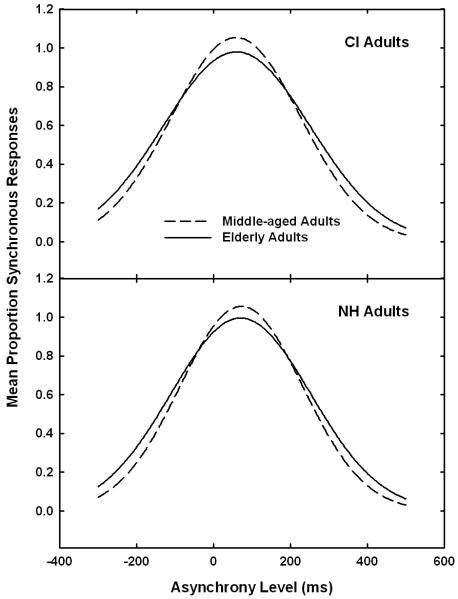
Figure 2.
The mean AV asynchrony data for the cochlear implant recipients and normal-hearing adults, generated using a curve fitting procedure described in the text. The mean proportion of the synchronous responses is displayed as a function of the asynchrony level. The top panel shows the data for the cochlear implant recipients and the bottom panel shows the data for the normal-hearing listeners. The solid lines show the elderly adult data and the dotted lines shows the middle-aged adult data.

