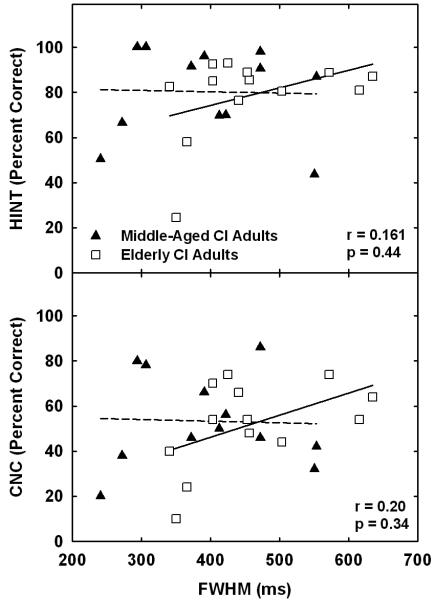
Figure 4.
Correlation results for the HINT sentences and CNC tests with the FWHM data. The top panel shows the results for the HINT data versus the FWHM data and the bottom panel shows the CNC data versus the FWHM data. The solid triangles and white squares show individual data for the middle-aged and elderly cochlear implant recipients, respectively. Linear regression lines for the middle-aged and elderly adults are displayed using the dashed and solid lines, respectively. The Pearson correlation results for the overall distribution of middle-aged and elderly adults, along with the significance levels, are displayed in each panel.

