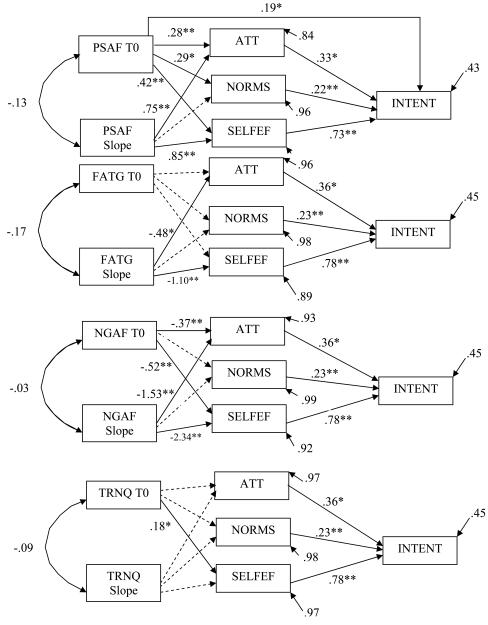
Figure 1.
Path models of the relationships between in-task affect and motivation at follow-up. 1a: Positive Affect (PSAF), χ2(1) = .19, p = .66, CFI = 1.00, RMSEA = .00 (.00, .18); 1b: Fatigue (FATG), χ2(2) = 1.12, p = .57, CFI = 1.00, RMSEA = .00 (.00, .15); 1c: Negative Affect (NGAF), χ2(2) = 1.86, p = .40, CFI = 1.00, RMSEA = .00 (.00, .17); 1d: Tranquility (TRNQ), χ2(2) = 1.62, p = .45, CFI = 1.00, RMSEA = .00 (.00, .17). Affect at T0: Baseline affect. ATT: Attitudes; SELFEF: Self-Efficacy; NORMS: Subjective Norms; INTENT: Intentions. Covariances between attitudes, self-efficacy and norms were estimated (all were positive and significant) but not shown for clarity of presentation. Paths estimated but not significant are shown as dashed lines.
*p < .05, **p < .01
Unstandardized regression coefficients are shown.

