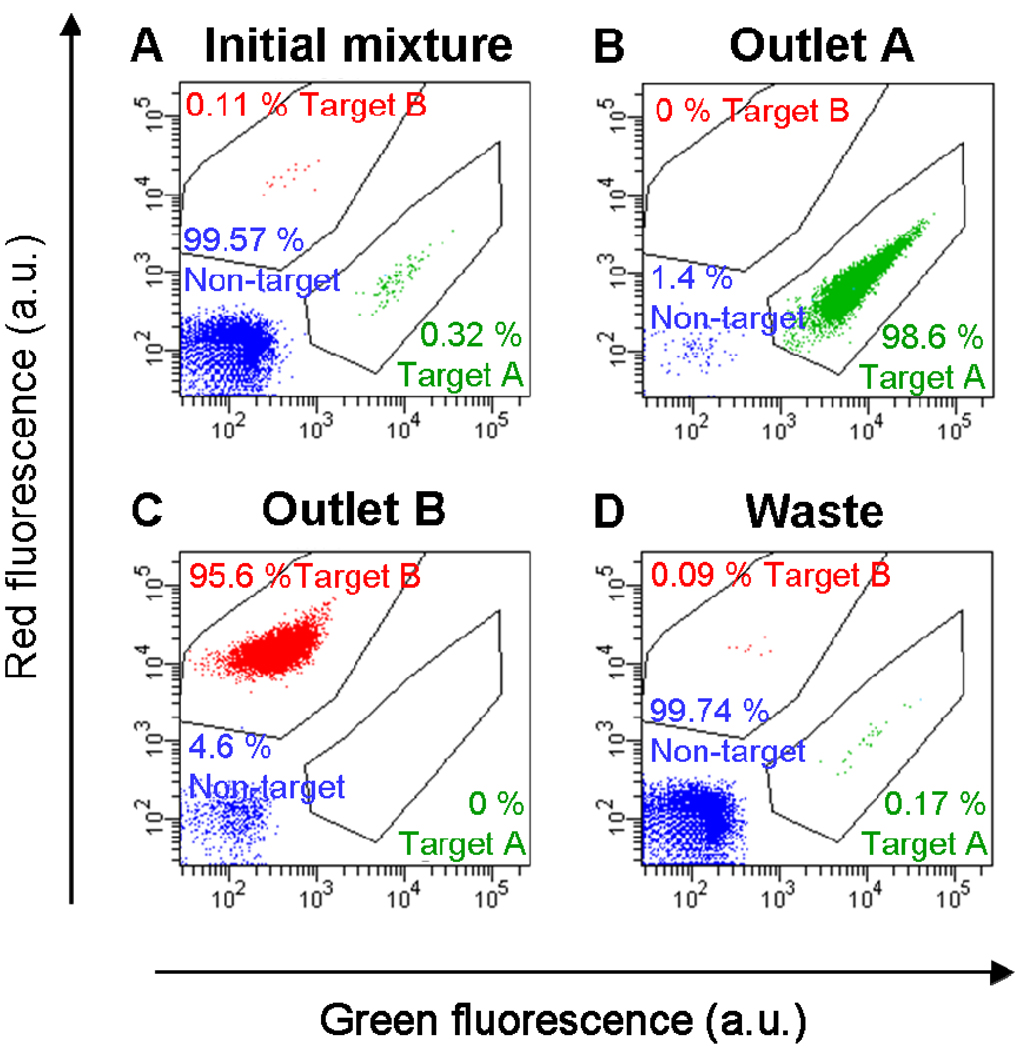
Figure 7.
Multi-target bacterial cell sorting performance using the iDMACS device. a) Two-color flow cytometry measurement of the initial sample, which consisted of an excess of non-target cells (99.57%) with low concentrations of labeled target A (0.32%) and target B (0.11% ) cells. b) After a single round of separation, the outlet A fraction contained almost exclusively target A cells (98.6%, a 310-fold enrichment), and no target B cells (0%). c) Conversely, the outlet B fraction contained primarily target B cells (95.6%, a 870-fold enrichment) and no target A cells (0%). d) The fraction collected at the waste outlet consisted of small quantities of target A (0.17%) and target B (0.09%) cells and mostly non-target cells (99.74%). Figure reprinted from Kim et al.42 with permission of the authors.

