
Figure 5.
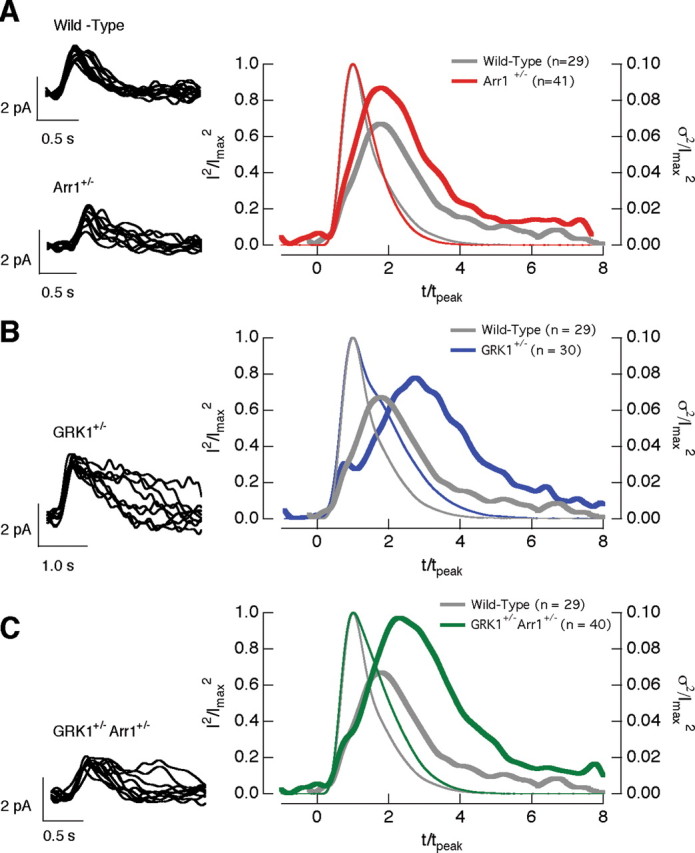
The time-dependent variance of the single-photon responses in wild-type, Arr1 +/−, GRK1 +/−, and GRK1 +/− Arr1 +/− rods. Left column superimposes 10 isolated single-photon responses from a wild-type and a Arr1 +/− rod (A), a GRK1 +/− rod (B), and a GRK1 +/− Arr1 +/− rod (C). Right column compares the squared mean (thin trace) and the time-dependent variance (thick trace) of wild-type rods (gray; n = 29) with Arr1 +/− (red; n = 41) rods (A), GRK1 +/− (blue; n = 30) rods (B), and GRK1 +/− Arr1 +/− (green; n = 40) rods (C). The responses in each cell were normalized by the amplitude and time-to-peak of the average single-photon response of the cell to facilitate comparison of the time course of the variance.