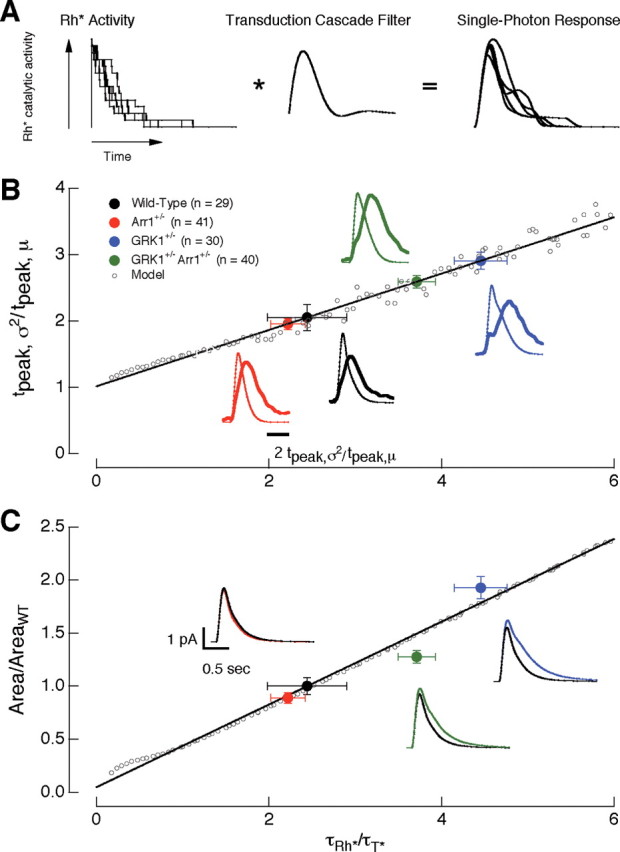
Figure 6.

The lifetime of rhodopsin determines the variability and area of the single-photon responses. A, Multistep shutoff model of the activity of rhodopsin. B, The ratio of the time-to-peak of the time-dependent variance (t peak,σ2) to the time-to-peak of the mean (t peak,μ) of the single-photon responses depends on the lifetime of rhodopsin (τRh*). The solid black line is fit to the predicted changes (open circles) in t peak,σ2/t peak,μ as a function of τRh*. τT* was kept constant at 200 ms. The experimental points (filled circles) are located on the fit at a y-axis location according to the measured t peak,σ2/t peak,μ ratio; the resulting x-axis position estimates τRh*. C, τRh* controls the area of the single-photon response. Filled circles are the experimentally determined normalized response areas. These values were positioned on the x-axis using the predicted τRh* determined in B. The solid black line is fit to the predicted changes in response area as a function of τRh*. Insets show the average single-photon response of 1000 simulated trials using the τRh* predicted from the model for each recorded mouse strain. The model captures the relative differences in amplitude and duration of the isolated single-photon responses in wild-type and mutant rods. Error bars are SEM.
