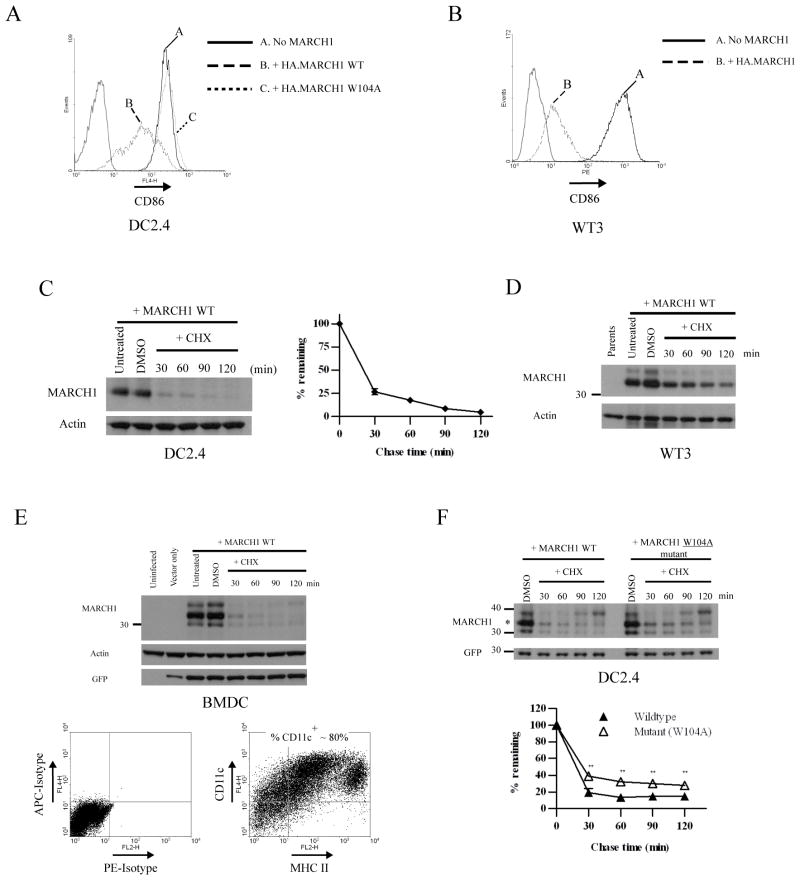
Figure 1. MARCH1 is unstable in multiple cell types.
A. CD86 expression on DC2.4 cells stably transduced with a lentiviral vector encoding either wildtype N-terminal HA-tagged MARCH1 (WT) or a RING-CH mutant (W104A). The thin gray peaks indicate staining with an irrelevant isotype-control antibody. B. CD86-expressing WT3 fibroblasts were stably transduced with retroviral vectors encoding MARCH1 with an N-terminal HA tag. The thin gray peaks indicate staining with an irrelevant isotype-control antibody. C. DC2.4 cells stably expressing N-terminal HA-tagged MARCH1 were incubated for the indicated times with cycloheximide, then lysates were blotted for MARCH1 (HA tag). Incubation in diluent (DMSO) was used as a control, and actin blots were performed as loading controls. Graphs show the turnover of MARCH1 from three independent experiments. The signal intensity of the MARCH1 and actin bands was estimated using Quantity One software. For each time point, the actin-normalized values were averaged between the experiments and graphed as the percent-remaining relative to time zero (DMSO-treated samples) +/− SEM. D. Immunoblot for MARCH1 (HA tag) and actin was performed from lysates of MARCH1-expressing WT3 fibroblasts incubated with cycloheximide for the indicated times. E. Mouse bone marrow-derived DC (BMDC) were generated as described in Materials and Methods, and infected with a lentiviral vector encoding HA-MARCH1. Experiments were performed three days post-infection. Top panel = cychoheximide-chase and immunoblot of MARCH1 in BMDC, performed as described above. Immunoblot for GFP was also included; GFP is encoded by the lentivirus. Bottom panel = purity of the BMDC preparations (MHC class II versus CD11c staining, and isotype-matched control staining). F. DC2.4 cells stably expressing HA-tagged MARCH1 or the W104A mutant were incubated for the indicated times with cycloheximide, and treated as in panel C. Full-length MARCH1 is denoted with an asterisk. Graphs show the turnover of MARCH1 from three independent experiments. For each time point, the actin-normalized values were averaged between the experiments and plotted as the percent-remaining relative to time zero (DMSO-treated samples) +/− SEM. **p<0.01.

