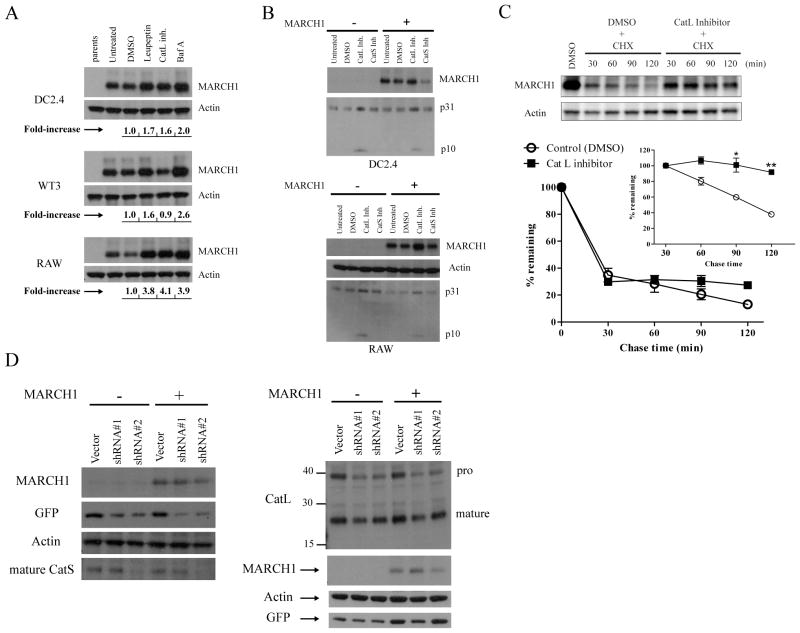
Figure 3. Lysosomal proteases affect MARCH1 turnover.
A. DC2.4, WT3, and RAW 264.7 (macrophage-like) cells were incubated for five hours with the indicated inhibitors: leupeptin, cathepsin L inhibitor (Z-FF-FMK), and Baf A. Cell lysates were then blotted for MARCH1 and actin. The band intensities were determined, normalized to actin, and displayed below the blots as fold-increase over control (DMSO). B. DC2.4 and RAW cells +/− HA-MARCH1 were incubated for five hours with the indicated cathepsin inhibitors and then cell lysates were blotted for MARCH1 and the invariant-chain (p31 and p10 fragments indicated). C. Cycloheximide-chase in HA-MARCH1-expressing DC2.4 cells +/− the cathepsin L inhibitor. Graphs show the turnover of MARCH1 from three independent experiments, where the signal intensity of the MARCH1 bands was quantified, normalized to actin, and graphed as the percent-remaining relative to time zero (DMSO-treated samples) +/− SEM. The inset graph shows quantitation of the same samples, except that it begins with the 30 min chase point, with all samples normalized to the 30 min value so that turnover of the MARCH1 remaining at 30 min could be evaluated. *p<0.05, **p<0.01. D. DC2.4 cells + HA-MARCH1 were infected with shRNA lentiviral vectors to knockdown expression of cathepsin S (left panel) or cathepsin L (right panel). For each gene, two different shRNA oligos were designed. At least three days or more after infection, lysates from the different cell lines were blotted with the indicated antibodies.

