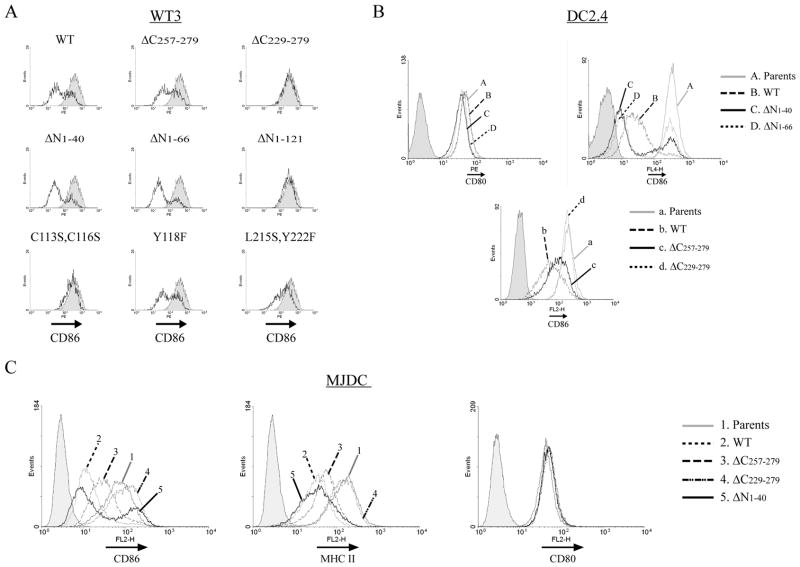
Figure 5. Comparison of the activity of the MARCH1 mutants.
A. WT3 fibroblasts that stably express CD86 were transiently co-transfected with MARCH1 expressing constructs and a GFP-expressing plasmid. Flow cytometry was performed to analyze surface CD86 levels two days post-transfection. The shaded peak indicates staining of cells transfected with the GFP plasmid alone, gated on the GFP-positive fraction. The heavy trace represents CD86 staining of the MARCH1 co-transfected cells (gated on GFP-positive cells). B. DC2.4 cell lines stably transduced with the indicated MARCH1 mutants were analyzed for surface CD80 and CD86 levels. C. MJDC cells were analyzed for CD86, MHC class II, and CD80 levels after stable retroviral transduction with the indicated MARCH1 mutant constructs. Cells were treated with 100 units/ml of mouse IFN-γ for 18 hours prior to analysis to increase transcription of MHC class II genes. The gray peaks in B and C represent staining of the respective parental cell lines (lacking MARCH1) and the shaded peaks represent staining of parental cells with an isotype-control antibody.

