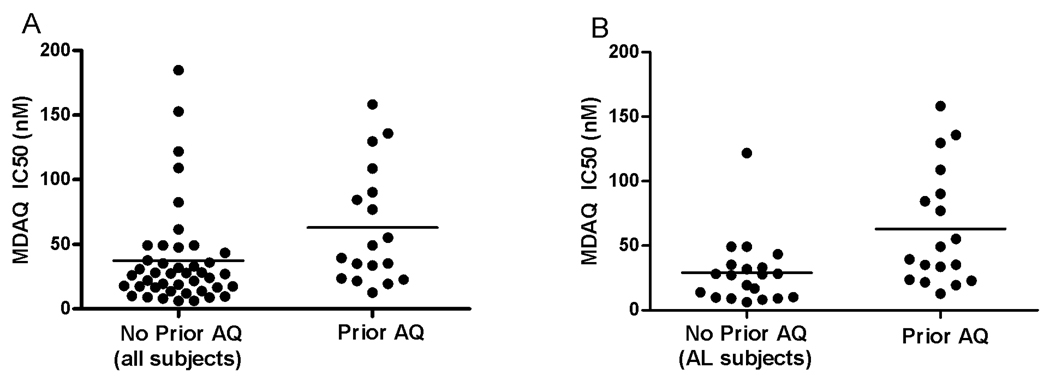
Figure 2. Selection of parasites with diminished response to AQ.
Sensitivities were determined as described in Methods, and results are plotted for parasites from all patients that did not receive an AQ-containing regimen within 12 weeks (No Prior AQ; A) or only patients in the AL treatment arm, who did not receive an AQ-containing regimen for the course of the study (No Prior AQ; B), in both cases compared to results for subjects who did receive an AQ-containing regimen within 12 weeks prior to the time of this analysis (Prior AQ). Means are indicated by horizontal lines. Differences for both comparisons were significant, as described in the text.

