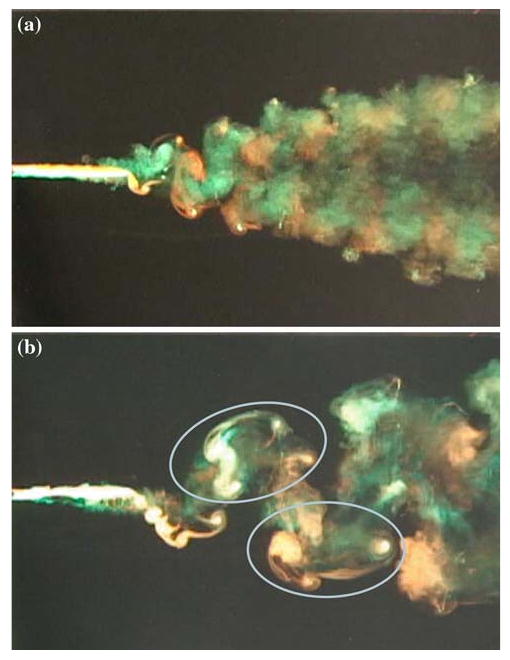
Fig. 14.

Wake visualizations under conditions of maximum measured propulsive efficiency for a AR = 0.54, A/S = 0.31, St = 0.27 and b AR = 1.11, A/S = 0.31, St = 0.24. In both cases, the simple wake structure observed in Fig. 13a was not observed at any Strouhal number. These images also appear in Buchholz and Smits (2008) (used with permission of the authors and Cambridge University Press)
