
Figure 4. Phenotypic Analysis of Peptide Selected CD8°OT-1 Cells Recovered from FTOC.
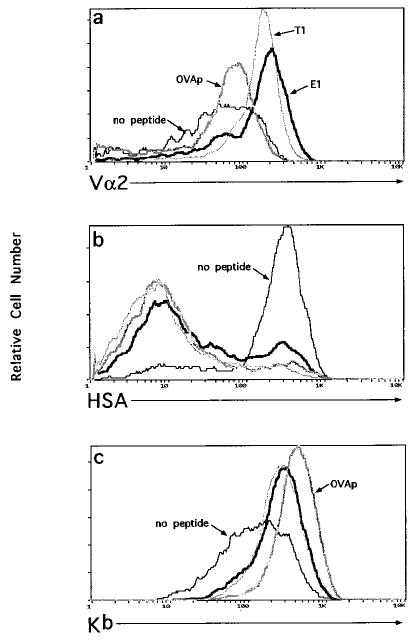
Thymocytes from CD8°OT-1 FTOC were stained for CD4 and CD8 with either Vα2 (total thymocytes) (a), HSA (CD4− gated thymocytes) (b), or H-2Kb (CD4− gated thymocytes) (c). Histograms of Vα2, HSA, and H-2Kb expression are shown for cells recovered from the following FTOC conditions: no peptide (thin solid line), 50 μM OVAp (thick gray line), T1 (thin gray line), or E1 (thick solid line).