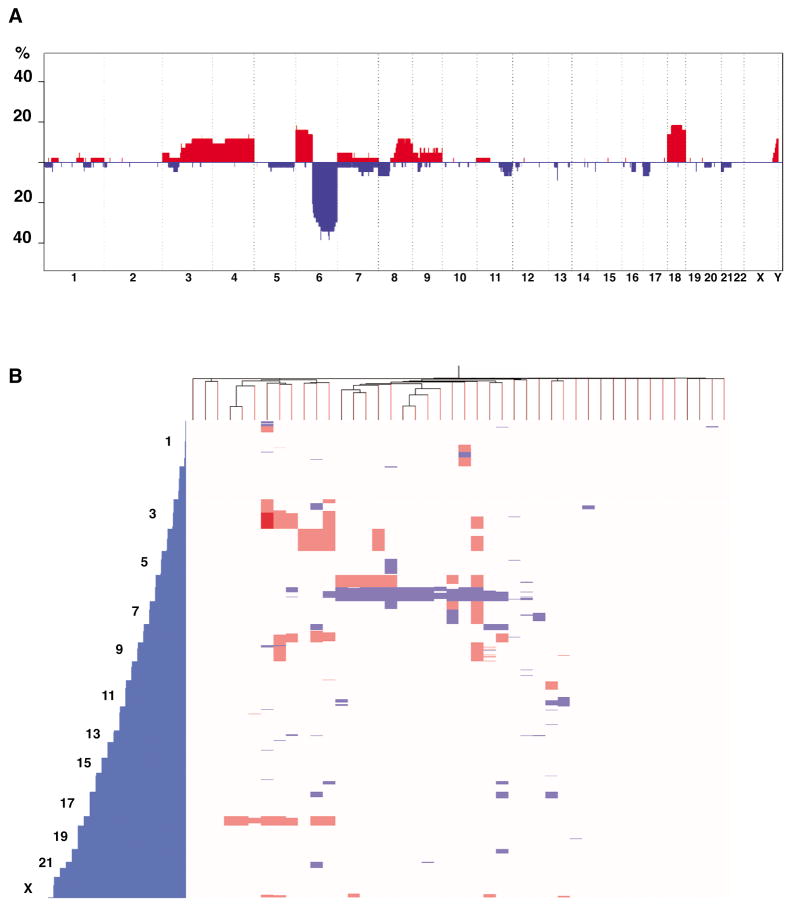
Figure 1.
Overview of the copy number abnormalities identified in WM. Red blocks represent chromosome gains; blue blocks represent chromosome losses. A) Penetrance plot summarizing the copy number imbalances per chromosome. The amplitude of each abnormality corresponds to its prevalence. B) Hierarchical unsupervised clustering done from the genomic imbalances detected by aCGH per chromosome.

