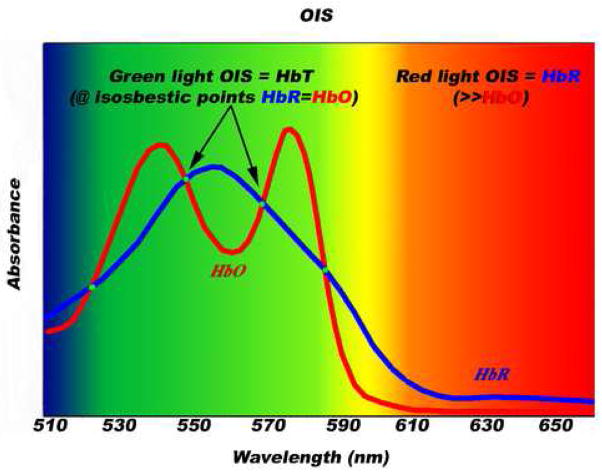
Figure 2. Green-light versus red-light OIS.
Hemoglobin is the major source of light absorption in the visible spectrum of exposed living brain. In the green spectrum, HbO and HbR have identical absorption at four different isosbestic points, hence maps with green-light OIS are largely maps of HbT changes. In the red spectrum, HbR absorbs light much more than HbO, hence maps with red-light OIS are largely maps of HbR changes.

