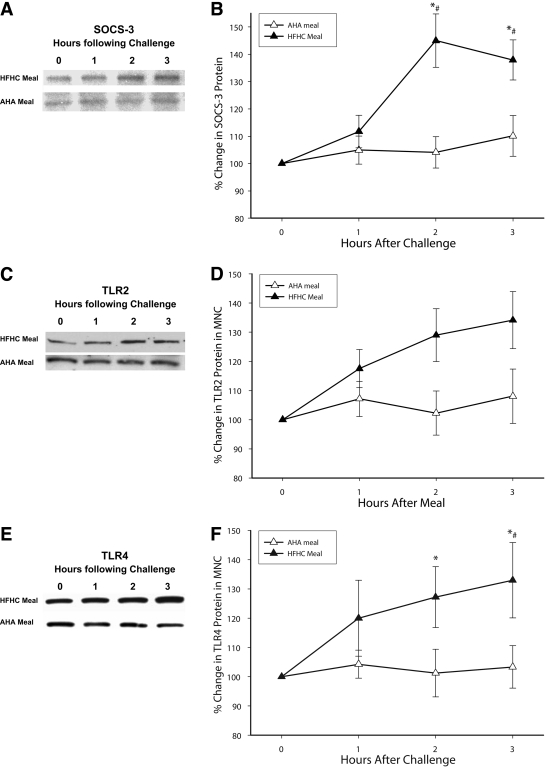
Figure 1.
SOCS-3 (A and B), TLR2 (C and D), and TLR4 (E and F) protein levels by Western blotting after an HFHC or AHA meal challenge in normal healthy subjects (n = 10 each). A: Representative SOCS-3 immunoblot in total cell lysate from MNCs. B: SOCS-3 protein densitometry (n = 10 each). C: Representative TLR2 immunoblot in total cell lysate from MNCs. D: TLR2 protein densitometry (n = 10 each). E: Representative TLR4 immunoblot in total cell lysate from MNCs. F: TLR4 protein densitometry (n = 10 each). *P < 0.05 by RMANOVA compared with baseline; #P < 0.05 by two-way RMANOVA comparing groups.

