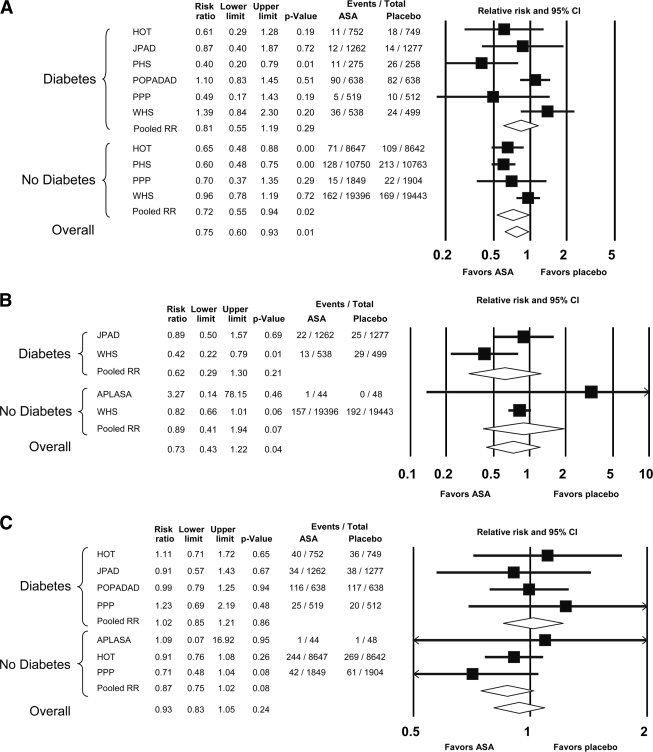
Figure 2.
Forest plots for mortality, myocardial infarction, and ischemic stroke. Forest plots of random-effects meta-analysis for pooled RRs of mortality (A), myocardial infarction (B), and ischemic stroke (C). Results are presented for patients with and without diabetes and for all patients combined. Squares and horizontal lines represent the point estimates and associated 95% CI. The diamonds represent the pooled RR, with the center representing the point estimate and the width representing the associated 95% CI. ASA, aspirin; HOT, Hypertension Optimal Treatment; PHS, Physicians' Health Study; PPP, Primary Prevention Project; WHS, Women's Health Study.

