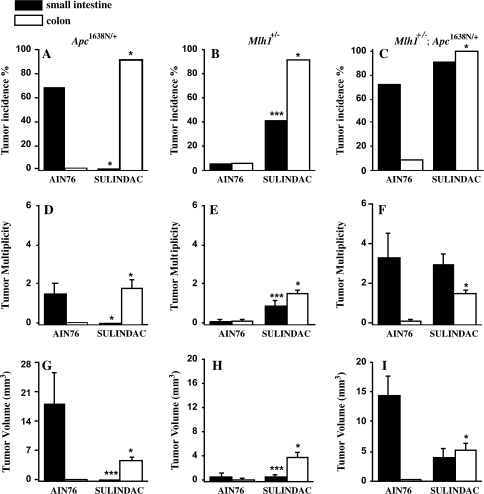
Fig. 1.
Tumor development in the intestine of mice with Apc1638N/+ and/or Mlh1 mutations. Tumor incidence, multiplicity and volume (mm3) in small intestine (filled bars) and colon (open bars) of Apc1638N/+ (A, D and G), Mlh1+/− (B, E and H) and Mlh1+/−; Apc1638N/+ mice (C, F and I). Histograms are expressed as mean ± SEM. Comparisons between sulindac and control groups (AIN76A) of each mouse strain using Fisher’s exact probability (two-tailed) test for tumor incidence; Mann–Whitney or exact binomial calculation for tumor multiplicity and volume. *P < 0.001, **P < 0.05, ***P < 0.01 versus AIN-76A.

