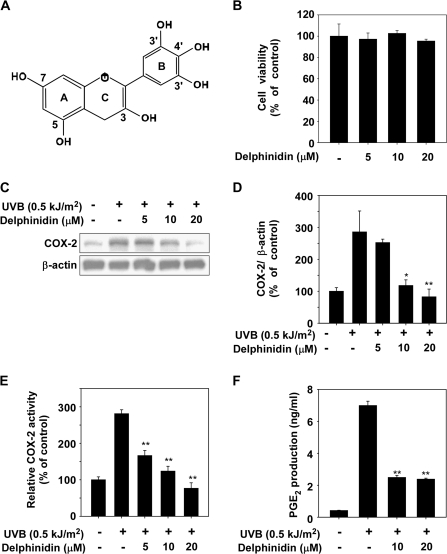
Fig. 1.
Effect of delphinidin on UVB-induced COX-2 expression and PGE2 production in JB6 P+ cells. (A) Chemical structure of delphinidin. (B) Effect of delphinidin on viability of JB6 P+ cells. JB6 P+ cells were treated with delphinidin at the concentrations indicated (0, 5, 10 or 20 μM) for 4 h. After incubation, 20 μl of CellTiter 96 Aqueous One Solution was added to each well, and the cells were then incubated for 1 h. Absorbance was measured at 492 and 690 nm. (C) UVB-induced COX-2 expression in JB6 P+ cells is inhibited by delphinidin. JB6 P+ cells were pretreated with delphinidin at the concentrations indicated (0, 5, 10 or 20 μM) for 1 h before being exposed to 0.5 kJ/m2 UVB and harvested 4 h later. The cells were disrupted, and COX-2 protein level was determined by western blot analysis as described in Materials and Methods. β-Actin was detected to verify equal loading of proteins. Data are representative of three independent experiments. (D) COX-2 and β-actin bands were quantified by densitometric analysis using the ImageJ software program. (E) Delphinidin suppresses UVB-induced COX-2 promoter activity. JB6 P+ cells, which were stably transfected with a COX-2 luciferase reporter plasmid, were treated with delphinidin at the concentrations indicated (0, 5, 10 or 20 μM) for 1 h before being exposed to 0.5 kJ/m2 UVB and harvested 6 h later. Relative activities were determined using a luciferase assay as described in Materials and Methods. (F) Delphinidin suppresses UVB-induced PGE2 production. JB6 P+ cells were treated with delphinidin at the concentrations indicated (0, 10 or 20 μM) for 1 h before being exposed to 0.5 kJ/m2 UVB and harvested 18 h later. PGE2 production was measured using a PGE2 assay kit as described in Materials and Methods. For (B–D) and (E–F), data are shown as mean ± SD and asterisks indicate a significant inhibition by delphinidin compared with the group treated with UVB alone (*P < 0.05 and **P < 0.01).

