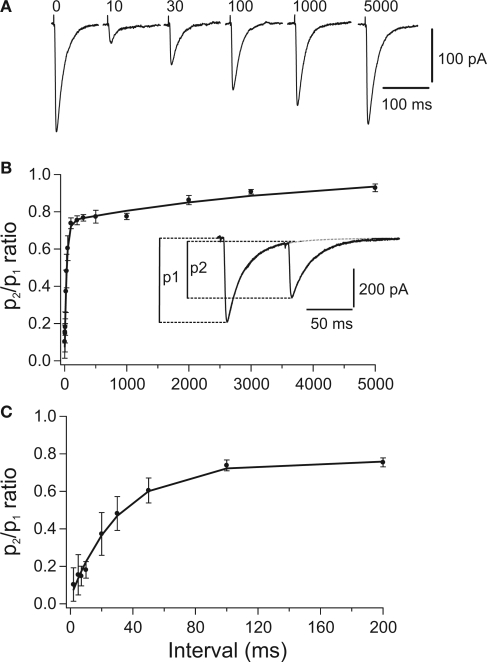
Figure 1.
Paired pulse depression (PPD) of compound PC-DCN IPSCs. (A) Representative example of IPSCs evoked by paired stimulation. Each trace illustrates the average of 25 single IPSCs evoked in a DCN by pairs of stimuli with different intervals applied to PC axons. Number above each trace indicates the interpulse interval in milliseconds. Traces corresponding to 10 and 30 ms were obtained after subtracting the response to the 1st stimulus (labeled with “0”). (B,C) Time course of recovery from PPD shown at two different time scales. Average peak amplitude ratio (p2/p1) was plotted against the interpulse interval (n = 24). The curves represent a double exponential expression fitted to the data. The peak amplitude of IPSCs was measured from the baseline to the peak of the respective IPSCs. Taken with permission from Pedroarena and Schwarz (2003).

