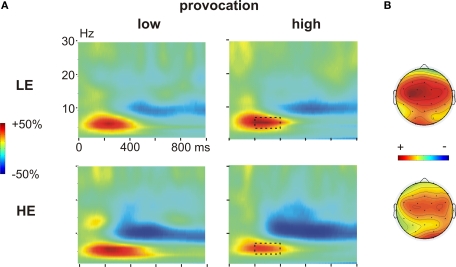
Figure 4.
Time frequency results decision phase. (A) Changes in power (%) relative to the baseline (100 ms before the decision phase) in low (left panel) and high (right panel) provocation trials at the left frontal electrode F3, separately for the LE (low experimentally induced aggression; upper row) and HE (high experimentally induced aggression; lower row) groups. Highlighted is the frequency (4–7 Hz) and time range (200–400 ms), which was analyzed for the theta effect. (B) Topography of the theta increase under high provocation in the LE (upper map) and HE (lower map) group. The scaling of the maps is −20 to 40% of power change. Note the higher theta power increase in the LE compared to the HE group.

