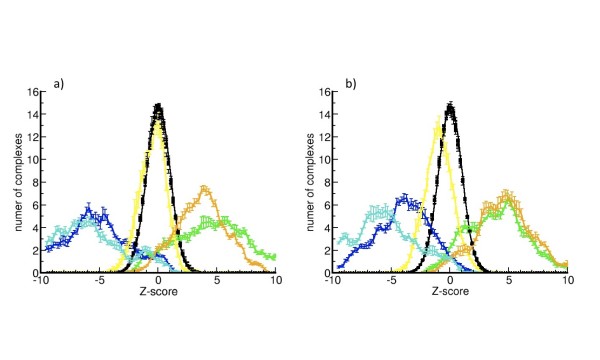
Figure 1.
5-fold average of the distribution of Zscores. Average of the distribution of Zscores using a 5-fold approach plus the ranges of error. Zscores are calculated with min-potentials (a) and Cβ-potentials (b) for real conformations: ZES3DC in blue, ZE3DC in green, ZElocal in orange, ZEREF in yellow and ZE in cyan. In black are shown the distributions of the averages of all Zscores of randomly shuffled sequences and their error ranges.

