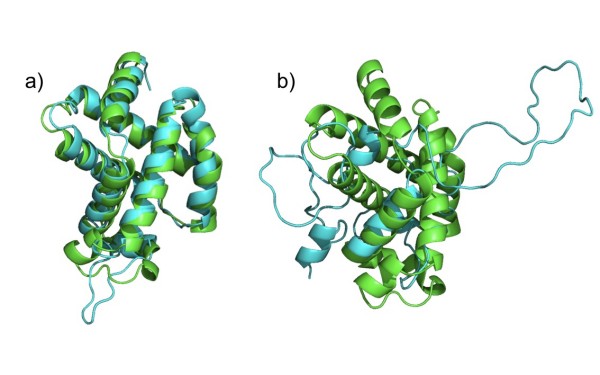
Figure 3.
Ribbon plot of 1dxt native and decoy structures. Ribbon plot of the native structure (in green) superposed with the model decoys (in cyan) of the target 1dxt in MOULDER. The structure of the decoy with smallest  score (model 51) is shown in 3.a and the structure of the decoy with highest
  score (model 262) is shown in 3.b.

