
Figure 4.
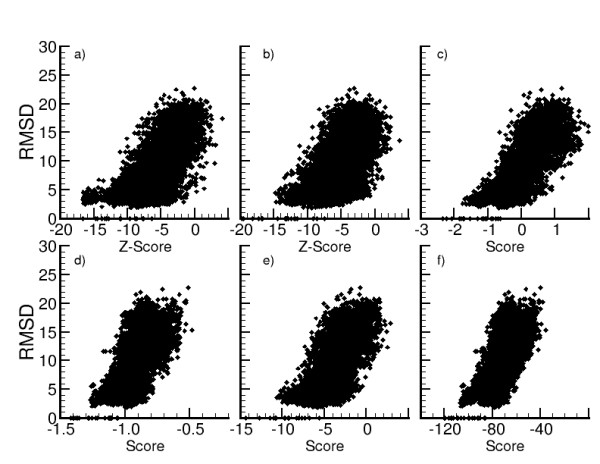
Comparison of RMSD/score resulting from several scoring functions. Root Mean Square Deviations (RMSD) of MOULDER decoys are plotted versus Zscores of  (a) and ZEmin (b), and versus scores normalized by the length of the sequence of Prosa2003 (c), DFIRE (d), GA341 (e), and DOPE (f).