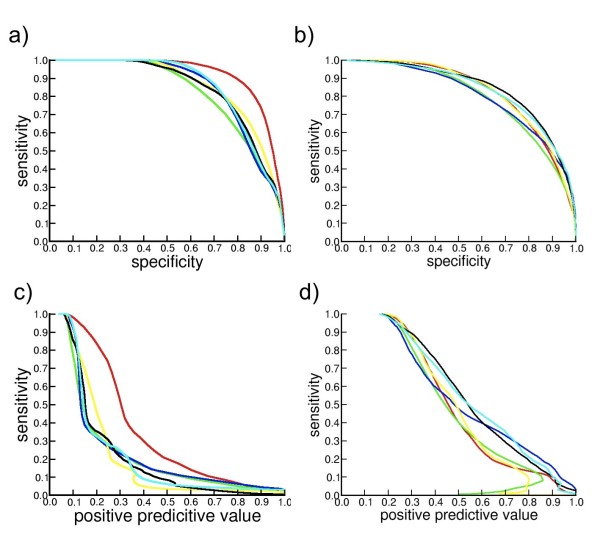
Figure 5.
ROC curves of scoring functions applied in MOULDER and 4state_reduced sets. Sensitivity is plotted versus specificity and Positive Predictive Value (PPV) for all decoy conformations from MOULDER set (5.a and 5.c) and from 4state_reduced set (5.b and 5.d). Scoring functions used are: Prosa2003 (red), DFIRE (green), DOPE (blue), GA341 (yellow),  (black) and ZEmin (cyan).

