
Figure 6.
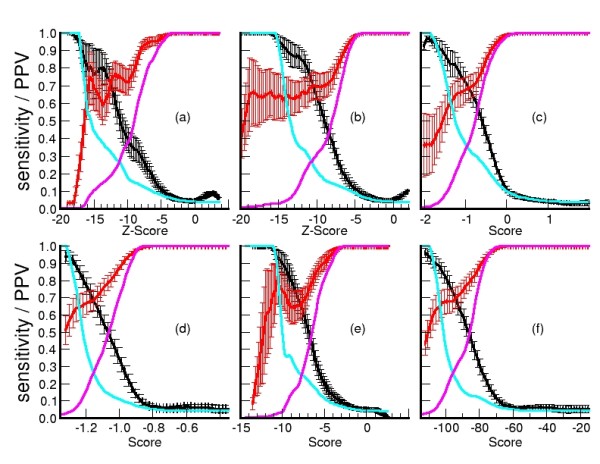
Sensitivity and PPV versus scoring functions applied in MOULDER decoy set. Average and standard error of sensitivity (red) and PPV (black) are calculated with the predictions in 20 target/model groups and total sensitivity (purple) and PPV (cyan) with the total of decoy models in MOULDER set. Score functions are:  (a), ZEmin (b), Prosa2003 (c), DFIRE (d), GA341 (e), and DOPE (f).