
Figure 7.
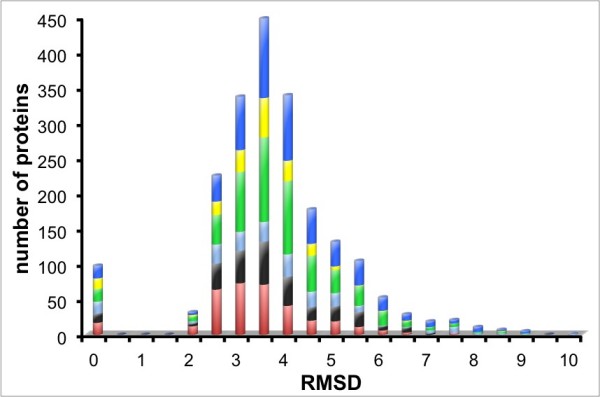
Distribution of RMSD of decoy-models in MOULDER set. Decoy structures predicted as positive for each scoring function are compared with their targets. The plot accumulates the predictions of the scoring methods:  (black), ZEmin (cyan), Prosa2003 (red), DFIRE (green), GA341 (yellow), and DOPE (blue). Most positives are found within less than 5Å from the original structure.