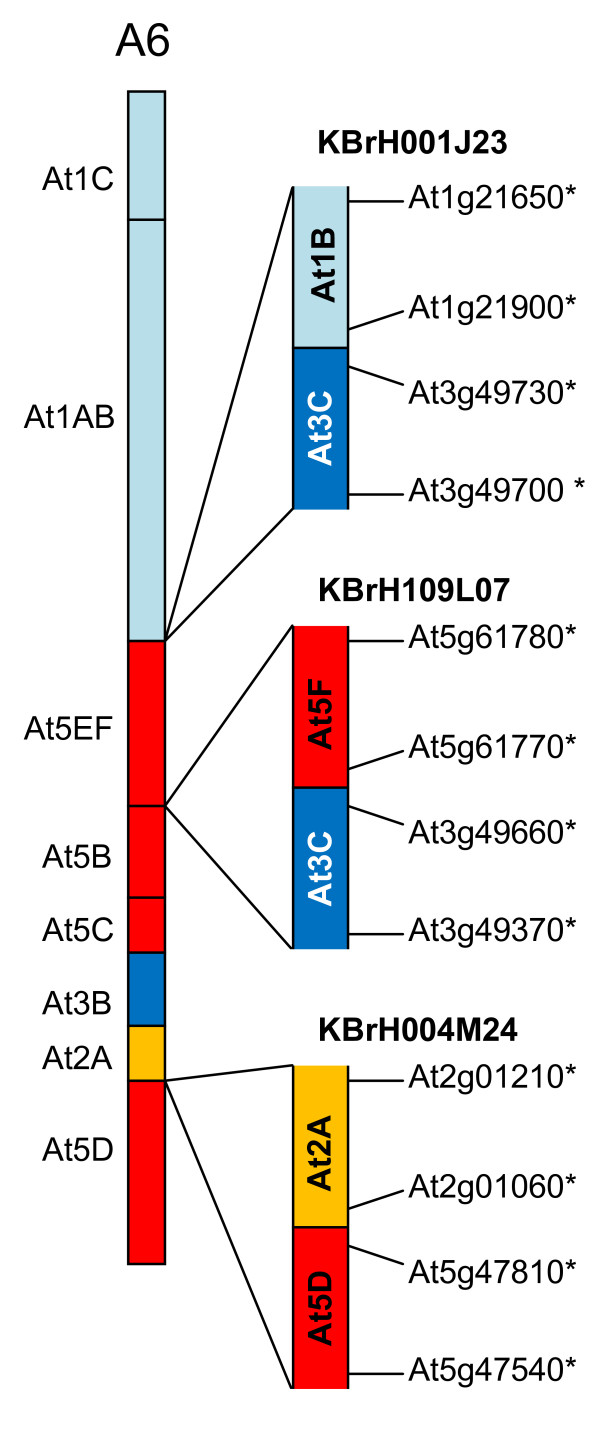
Figure 5.
Collinearity discontinuities mapped to B. rapa linkage group A6. The sequenced BAC clones are illustrated in relation to the CDs with which their mapping is consistent, as represented in [9]. Orthologues delineating the boundaries of recombination events and the end-most aligned gene models within the BACs are designated by the name of the A. thaliana gene model suffixed "*".

