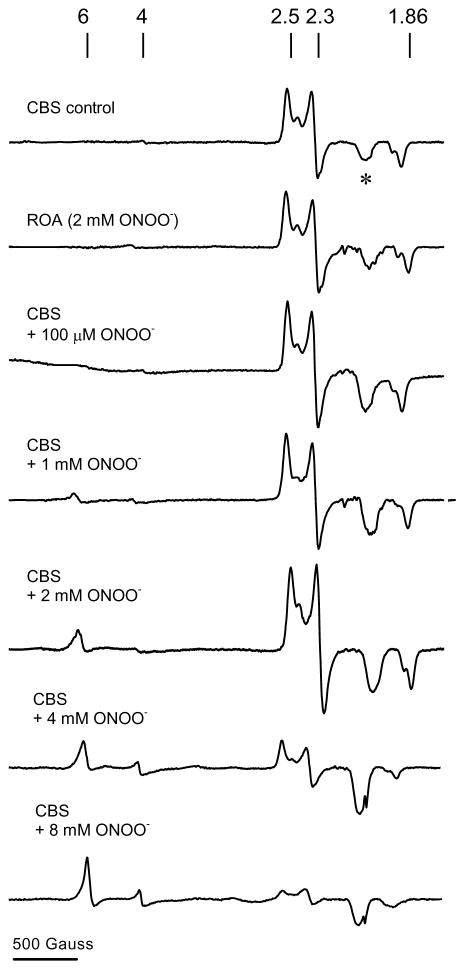
Fig. 4.
EPR spectra of peroxynitrite-treated CBS. Fe(III)CBS (120 μM) was mixed with increasing concentrations of peroxynitrite (0–8 mM) in phosphate buffer (0.1 M, pH 7.4). After 5 min at 37 °C, samples were frozen in liquid nitrogen. The EPR spectra were recorded at 10 K, 1 mW microwave power, 2 × 10⁴ receiver gain, 12.78 G modulation amplitude, 9.393 GHz microwave frequency, and 100 kHz modulation frequency using 1024 data points. Each spectrum represents a single scan. The asterisk denotes a signal present in the cavity. The line markers are at g = 6, 4, 2.5, 2.3, and 1.86, respectively. ROA, reverse order of addition control.

