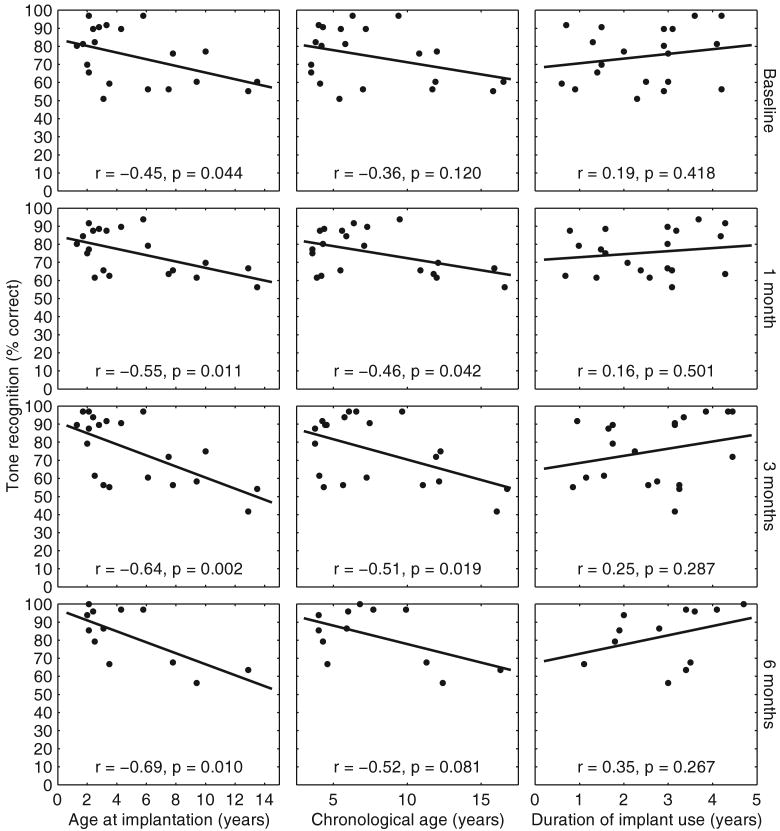
Fig. 3.
Relationship between tone recognition and age at implantation (left panels), chronological age (middle panels), and duration of implant use (right panels). The four rows of panels from top to bottom represent the four tone test intervals: baseline, 1, 3, and 6 mo follow-ups. The solid lines represent least-squared linear fit of the data. The correlation coefficient (r) and p values are shown at the bottom of each panel.

