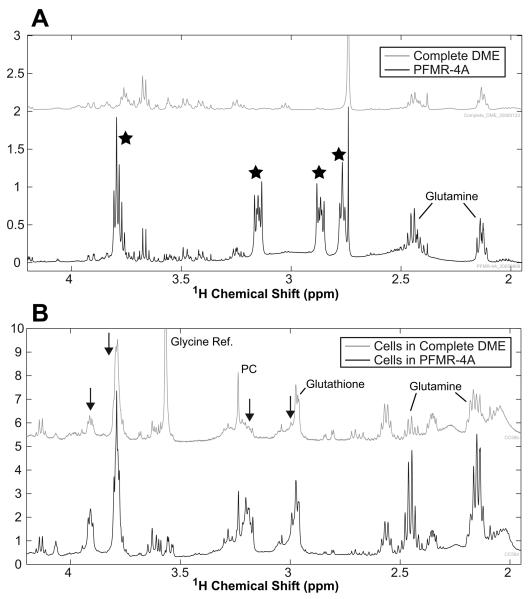
Figure 2.
(A) Proton HR-MAS spectra of DME medium (TOP) and PFMR-4A medium (BOTTOM). The ) that ultimately contaminated PFMR-4A spectrum contains several large peaks ( the spectra of the cells cultured in this medium prior to harvesting the cells as shown in the bottom of (B). By culturing the cells in DME for the last 24 hours (TOP of B), the spectral contamination caused by the PFMR-4A medium was significantly reduced as indicated by the black arrows. In addition, the glutamine levels were significantly reduced because the DME medium contained less glutamine. Note the large glycine peak in the DME cell spectrum was produced by the reference compound added for the HR-MAS experiment.

