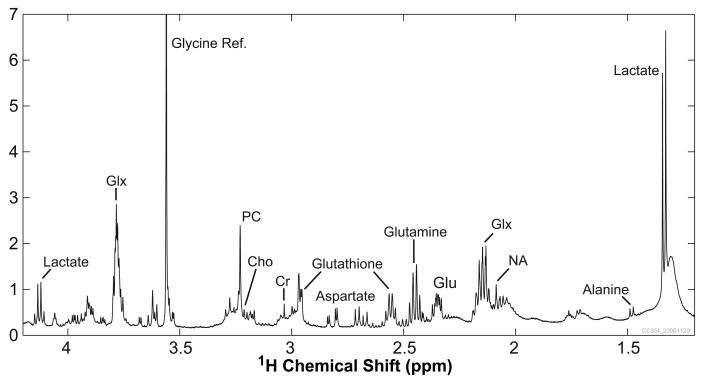
Figure 3.
Representative 1H[13C] HR-MAS spectrum from primary cultured prostate cancer cells. The spectrum was acquired from 25.6 mg of cells in 16.1 min. Prominent peaks include the glycine reference, lactate, phosphocholine (PC), aspartate, glutathione, glutamine, glutamate (Glu), and Glx (composite of glutamate, glutamine, and glutathione). Cho: choline; Cr: creatine; NA: N-acetyl peak

