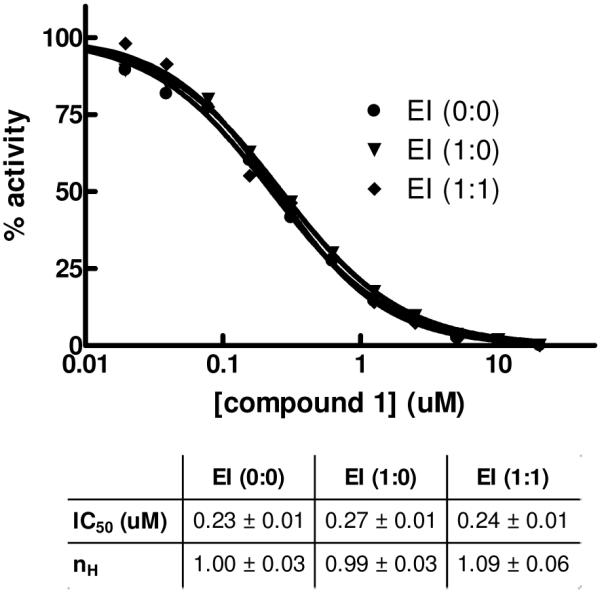
Figure 5.

Time-dependent mechanistic studies of TNAP inhibition with 1. The enzyme was added with compound 1 serially diluted immediately prior to activity measurement (circle, EI (0:0)) or pre-incubated with the compound for 1h at 12.5-fold the concentrations and then diluted to final concentrations with (diamond, EI (1:1)) or without (inverted triangle, EI (1:0)) an additional 1h incubation after the dilution and prior to activity measurement. The dose-response curves were analyzed using Hill equation; best-fit parameters (IC50 and Hill coefficient nH) and their standard errors of fit are shown in the Table.
